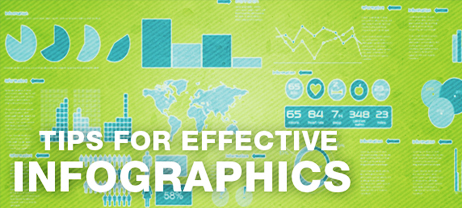
Infographics can impress customers, attract more traffic, establish brand image and convey messages in an efficient manner. Worldwide marketers use infographics to attract more and more audiences. However, they should use aggressive and strategic Infographics creation and promotion techniques for better results.
Here are a few techniques to make your Infographics more effective:
- Powerful headings – Create highly attractive headings for your infographics. Headings should be relevant and catchy. (Good headings attract and engage audiences and reduce the overall bounce rate of a website.)
- Write relevant introduction – Marketers should write compelling introductions of their infographics to catch the immediate attention of their audiences. (Tip – Write catchy introduction of your infographics.)
- Colour combinations – Use simple and attractive colours for your infographics. (Tip – Prefer combinations of yellow and red in your infographics and avoid using dark colours.)
- Easy to read fonts – Use easy to read fonts and numbering throughout your infographics for better visibility, understanding and overall traffic. (Tip – Stick to a minimum size 14 to 18 font depending on the theme of your template.)
- Numbered Navigation – Numbered or well defined navigation helps viewers to understand your infographics much more easily. In fact, it keeps your users engaged.
- Sections – Always try to divide your infographics in separate sections for greater understanding and improved visual appeal. (Fact – Infographic is a powerful visual learning tool.)
- Use facts and figures – Always include factual information in your infographics. This is also a good technique to support your topic and subject matter. (Tip – Choose the right charts and statistical figures for your infographics.)
- Appealing images – “A picture is worth a thousand words”, so use high quality and appealing images to attract more viewers. (Tip – Use good images to improve the popularity of your infographics.)
- Business logo – Integrate high quality logo’s to your infographics for better brand image. You should also include CTAs, your website address as well as references for better visibility.
- Optimise your infographics – Marketers should include their keywords across infographics for better rankings and traffic.
- Share it – “Sharing is caring”, share your infographics on the powerful social media platforms for instant popularity. (Tip – Infographics can help you to reach a broader audience.)
No doubt, visual storytelling is a great marketing strategy. So, make your infographics simple and informative to establish your brand image as well as drive greater traffic.
Quick facts:
- Content with relevant images gets 94% more views than content without irrelevant images.
- Picture-based posts have 600 times more engagement than text-based messages on social platforms.
- Use infographics to explain hard-to-grasp concepts.
- Infographics have a longer life span.
- Visuals are the most effective content for social sharing.
- Photos, pictures and videos get over 100% more engagement.
- The most popular presentations have an average of 37 or more images.
- 50% of posts on tumblr are photos.
- Publishers who use infographics grow their traffic by 12%, more than those who don’t.


